Q&A 9 How do you perform PCA on genotype data to assess population structure?
9.1 Explanation
PCA (Principal Component Analysis) is a standard method to explore genetic diversity and detect hidden population structure in GWAS datasets. It helps:
- Control for confounding due to stratification
- Visualize sample clusters or outliers
- Generate covariates (
PC1,PC2, etc.) for use in association models
We apply PCA on the imputed genotype dosage matrix, excluding identifier columns (FID, IID), and then combine the results with sample IDs.
9.2 R Code
# Load libraries
library(tidyverse)

# Step 1: Extract genotype matrix (exclude FID and IID)
geno_numeric <- geno_imputed[, -c(1, 2)]

# Step 2: Perform PCA using prcomp
pca_result <- prcomp(geno_numeric, center = TRUE, scale. = TRUE)

# Step 3: Combine first 5 PCs with sample IDs
pca_df <- geno_imputed[, 1:2] %>%  # FID and IID
  bind_cols(as_tibble(pca_result$x[, 1:5]))  # PC1 to PC5

# Step 4: Plot PC1 vs PC2
ggplot(pca_df, aes(x = PC1, y = PC2)) +
  geom_point(size = 2, alpha = 0.7) +
  labs(title = "PCA of Genotype Data", x = "PC1", y = "PC2") +
  theme_minimal()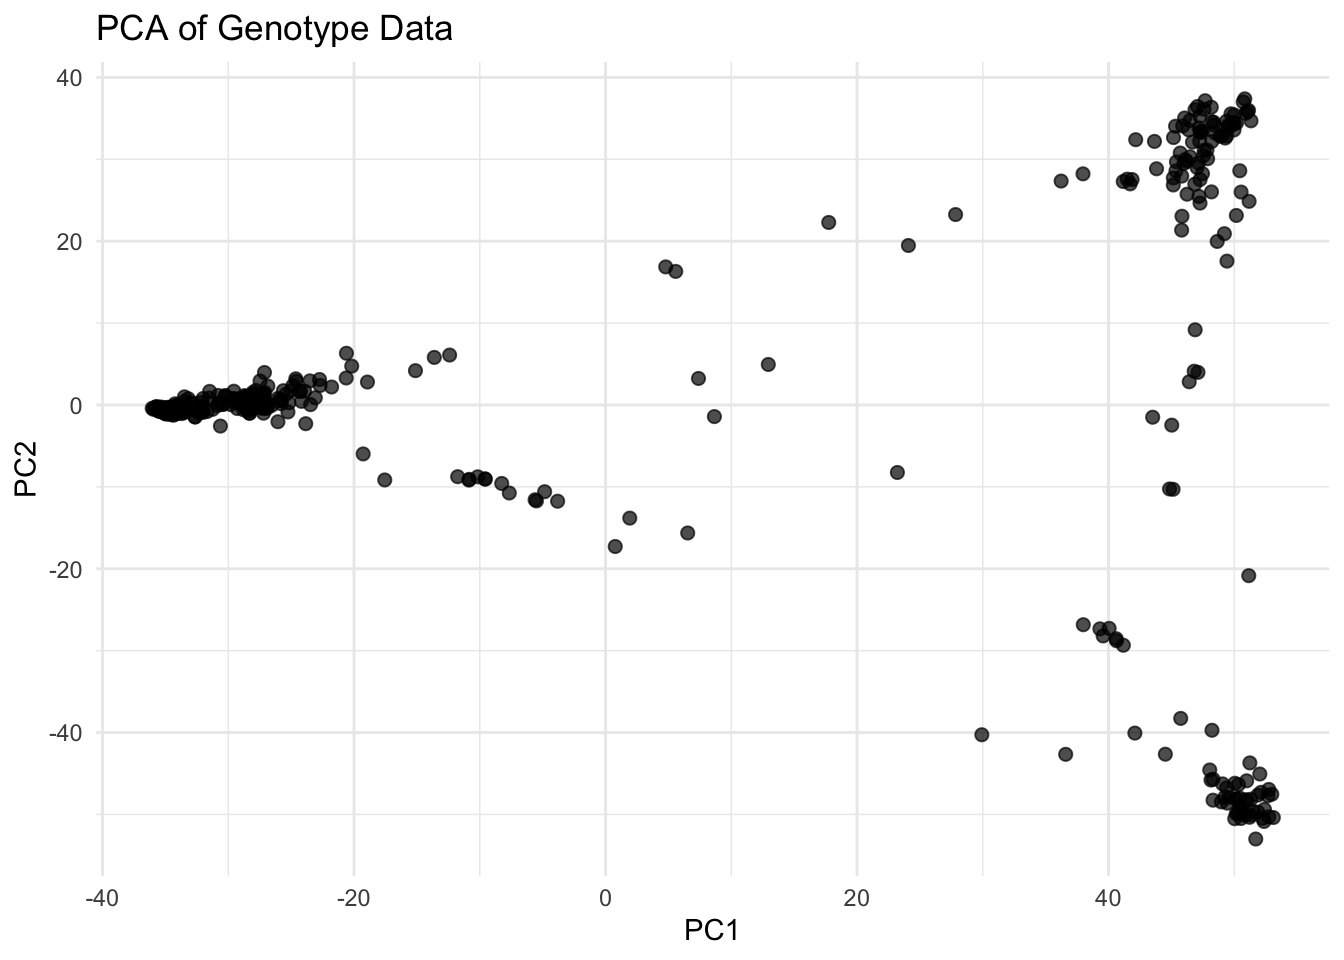
✅ Takeaway: PCA helps uncover hidden structure in your GWAS population. Always reattach
FIDandIIDto PCA scores so they can be merged with phenotype and genotype metadata for downstream modeling.